
Radar interferometry uses pairs of satellite (radar) scenes of an area for creation a digital elevation model (DEM), or a deformation model. According to foreign papers, it is primarily used for mapping of postseismic deformations, which are usually considerable both in the area affected and in scale. For landslides mapping, the method is not so convenient and one must always remember the following limits:
size and orientation of the movements which occured in the given period,
the temporal difference between the two scenes with respect to the velocity of the landslides,
the vegetation cover of the area of interest and it's surrounding (for comparison).
Each pixel at the radar scenes contains not only the magnitude (corresponding to reflectivity) but also the phase, corresponding to the distance between the satellite and the given place at the Earth's surface. But, this phase is only in the (-pi, pi) interval, corresponding to the distance of the interval ( 0, 2.8) cm, because the two-way distance is measured and the radar wavelength (for ERS) is 5.6 cm. For that reason, it is not a regular distance, but only the difference between the true distance and a integral multiplication of half the wavelength.
The phase, as is, has no practical meaning, because the distance between the given place on the Earth and the satellite cannot be determined with such an acuuracy. But the phase difference between two scenes is already senseful: no matter if these scenes come from different places or were acquired at different time. If the scenes are acquired at different positions (although they must image the same area), the interferometry method is used for computing the digital elevation model in the given area; if there is not a negligible temporal baseline between the two scenes, the interferometry method can be used for deformation mapping in the given area.
Interferogram creation is nothing else than subtracting the phase of the two scenes - the resulting phase must be in the (-pi, pi) interval. After interferogram creation, it is also neccessary to subtract the flat-Earth phase. The interferogram then contains
the topographic signal, given by the influence of the altitude to the distance between the satellite and Earth surface,
the deformation signal, containing the movements occured between the acquisitions of the two scenes,
errors in the satellite positions and atmosphere inhomogeneities (both are "longwave" signals, i.e. not a noise, but a "slanted area").
The atmospheric influenc cannot be eliminated entirely, but can be reduced by an appropriate data selection with use of meteorological data. Orbit inaccuracy influence is possible to eliminate, we are just testing various methods. In the case of DEM creation, we select the scenes with a very short temporal baseline, in the case of deformation mapping, we subtract the topographic signal using a DEM. This DEM must be either from the interferometry method (three- or fourpass methods), or it can originate from other sources (twopass method).
Let's imagine the satellite trajectory above the given area (next to it, see figure) as a line. The radar measures the distance between the line and the given area at the Earth (the appropriate pixel). That means it is not able to observe a change if the distance between the Earth surface and the satellite trajectory remains the same.
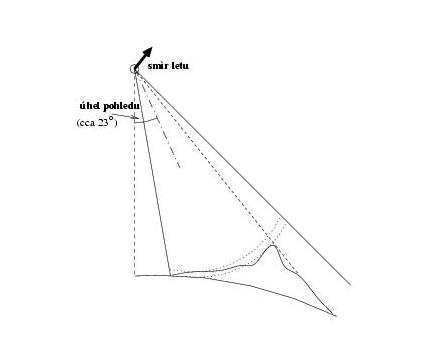
Let's also stress that the radar measures only the deformation in the direction of the ray, i.e. cca 23 degrees off the vertical (ERS).
Radar doesn't observe the phase as is, but only the difference between the total phase and the integral multiplication of half the radar wavelength (2.8cm). In practice it means that if a part of the area moved between the acquisitions of the two scenes by 10.0 cm and the rest of the area doesn't move at all, we will observe the movement of 1.6 cm. If a part of the area doesn't move at all and other part of these 10 cm and the transition between them is slow, we will find fringes in this area, each signifying a movement by half the wavelength. But, if the movement is too large, decorrelation occurs.
In addition, we can only measure relative movements with respect to a stable area. If the entire processed area moves by the same distance, the result will be the same as in the case it doesn't move at all (the phase image of the interferogram will be homogeneous).
The theoretical value of the maximal "steepness" of the movement is half a fringe per pixel, i.e. approximately 2.8 cm / 20 m. However, with respect to the noise and possible decorrelation, processing of this data may be easily impossible.
On the other hand, if the movements are too small, they "lose" in the noise and are impossible to detect in the interferogram. We can influence the size of the movements by appropriate interval between acquisitions of the two scenes.
More details about precision, sensitivity and reliability of this method can be found in the section Sensitivity threshold.
The phase value of a pixel is a superposition of many small reflectors - the greater the reflectivity of a reflector (in the direction back to the satellite), the more weight it has in comparison to others. Considering the fact that a pixel is approx. 20 x 20 m large, there are very many of these small reflectors. And with respect to the fact that the radar wavelength is 5.6 cm, the phase is influenced also by small movements.
The phase value of an interferogram pixel is a difference of the phases of the two scenes. In addition to interferogram, the coherence image is computed, which shows the "reliability" of the phase in the given area. It is a statistical indicator denouncing variance of the phase difference in the surrounding of the given pixel (e.g. 5 x 5 pixelů). If the area is the same on both scenes (it didn't move), the interferogram phase is constant in the area. If the entire area moved, the phase is also constant, but has a different value than it's surrounding. The coherence is hing in the area if the area is at least 5 by 5 pixels large. But if the movement is inconstent (i.e., each reflector moved differently), the phase value of different pixels is different, almost random, and the coherence is low. We call such an area to be decorrelated.
In the phase image, decorrelation shows up as the "granulous", i.e. random phase.
The causes of decorrelation are the following:
the difference in the look angle of the two scenes is too large, the scenes may be acquired at different satellite track or even by different satellites. This can be easily avoided by appropriate data selection,
a great handicap is the vegetation. The leaves of the trees or grass are moving with the wind and it is impossible to acquire both scenes with the same position of leaves and grass; their phase has quite a large weight when superpositing all the reflectors,
water surfaces are always decorrelated. They are mirror reflectors and reflects almost all the energy away from the radar, and the little energy going back to the radar is just a noise,
landslides and other deformations, which are not "stable" in the area of approx. 100 by 100 metres, or occured in the direction of the flight of the satellite,
other influences, e.g. ploughing up the agricultural field, new buildings etc. (these can be partially eliminated by appropriate data selection).
Let's add here, that the cause of the decorrelation cannot be determined without external informations.
There are no Earth deformations in these areas. Also, it is senseless to consider the decorrelated areas here, because the deformation information is very irreliable here. Thus, we will only consider the areas with high coherence.
The phase image is plain-coloured, i.e. homogeneous here.
The theoretical sensitivity of the method is about 1 cm. But, it is enlarged but other influences, e.g. phase unwrapping errors when using the three-pass method (most significant in the case when the processed area has more high-coherent areas which are separated by low-coherent areas), external DEM errors (when using the two-pass method), satellite orbit errors, atmospheric influence, a large spatial baseline between the two satellites etc. It is apparent, that if the standard error of the phase in a given areas enlarges due to one of these causes, the sensitivity of landslides detection worsens.
The areas where deformation occured have in the resulting (differential) interferogram different colors than their surrounding. These areas are typically small (few pixels, 1 pixel corresponds to the area of approx. 20 x 20 metres), which makes their detection a prove of reliability more difficult. The reliability can be verified by generating more interferograms and comparing them, but that wasn't possible in our case due to lack of data.
Accuracy of the method, if enough data are available, could by approximately half a centimeter.
Last update 6. 02. 2021, ivca@insar.cz